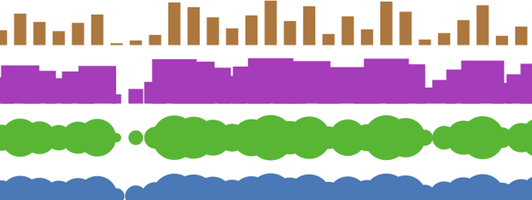
Better banking visualization
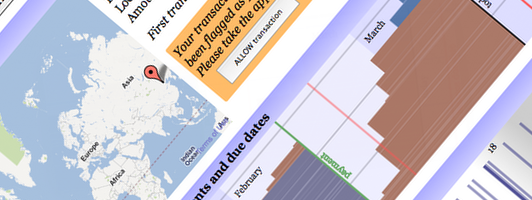
An interactive infographic showing how a better banking information system could facilitate your understanding and control of your spending habits.
I don’t use credit cards as means of delaying payment over a longer period of time, but I like their ease and simplicity. Swipe and go (This was before VPay). I pay no fees. Simple.
Of course when it’s time to view my credit card statements online it’s a big pain to visualize my recent transaction history. Perhaps this is simply with my bank but it seems they want to make it as hard as possible or simply don’t care about user experience. If I want to view past transactions my only option is to download a PDF for each month. If I make a partial payment of my credit card balance owing, the system will only ever show me the total and never update to what remains. Only when the payment due date passes will it update and tack on interest and the remaining balance. I decided to create an interactive mock-up of what could be done to provide a more informative and usable experience when trying to understand the situation of your credit card debts.