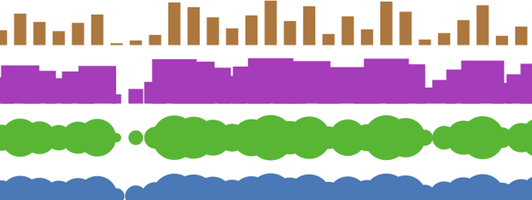
Cartographic symbol generator
Take a second to check you understand how to scale chart and cartographic symbols appropriately.

I have spoken about inappropriately sized symbols in other posts before. While generating some of the graphics for those articles I realized that it would be quite easy to generate the symbols automatically based on their values rather than trying to size them manually within the graphics editor. This could prevent myself as well as others inadvertent editing mistakes as well as methodological ones where people simply do not consider the correct representation of symbols.
The interactiveness also helps to better understand the appropriateness of linking different value ranges to symbols of different dimensions.
Check out the resulting Cartographic symbol generator github page for more details.


