Cyrille MdC

FrakturMedia

GIS, transport, society and other analytical ramblings.

Baltrum, a car-free island community

Our car culture is one alternative, others work fine too.

Cyrille MdC

6-Minute Read

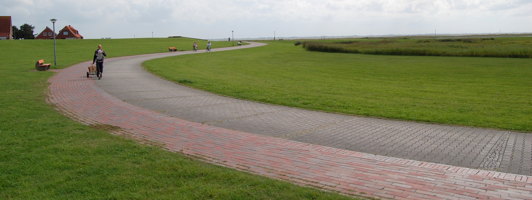
As you leave behind a car park and, after a 40 minute ferry trip, arrive to a much more peaceful wagon park, the car-free contrast is jarring. Not only is the setting calmer but the people have also relaxed. No one is in a rush to find parking, get luggage from the car, get on the ferry before it leaves. Each family walks down the rows of wagons looking for the one with their house number on it. These transport wagons sport a hitch to be mounted behind a bike but also two hand grips so they may…

Cartographic symbol generator

Take a second to check you understand how to scale chart and cartographic symbols appropriately.

Cyrille MdC

1-Minute Read

I have spoken about inappropriately sized symbols in other posts before. While generating some of the graphics for those articles I realized that it would be quite easy to generate the symbols automatically based on their values rather than trying to size them manually within the graphics editor. This could prevent myself as well as others inadvertent editing mistakes as well as methodological ones where people simply do not consider the correct representation of symbols.

Infographic failure

Infographics are power and effective, yet conversely can be empty of meaning, lie and communicate incorrect messages without the intent.

Cyrille MdC

6-Minute Read

Infographics serve to simplify the communication of complexity by showing shapes, relationships, metaphors, hues, flows and symbols to represent values. A visually clean and attractive layout is common. We are more quickly able to compare visual values such as areas than numbers. Numbers and words require a more steps: deciphering (reading), translating to meaning and finally absorption. Visual symbols are directly absorbed.

Recent Posts

Categories

About

Some data analysis ramblings on transport and society using GIS, R, Python, and other effective tools.