Green bands
What amount of trees along highways offsets their transport emissions?
Many cities have green belts of either forest or agricultural fields. These areas are delineated and maintained to create accessible green recreation/athletic spaces, preserve rich agricultural soils, allow wildlife to return, improve air quality and simply provide aesthetically pleasing views.
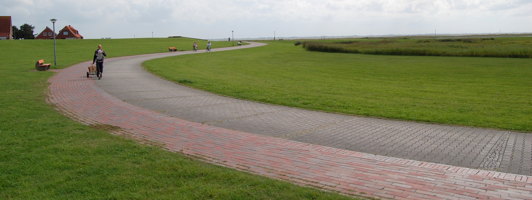
Driving along the highway during the end of a 4,000 Km road trip, Julia mentioned that it would be interesting to know how much forest is required next to the highway to compensate for the C02 created by the vehicles on it. This obviously depends on the number of cars that travel along the highway, their speed, fuel efficiency and the type of forest along the highway.
So the fundamental question is how much C02 is created by a Highway’s travel and how much forest is required to absorb it?
One square kilometre of temperate forest consumes 540 Kg per day (source: <sustainability.tufts.edu>) A car consuming 6 litres of gas per 100 Km creates about 0.1455 Kg/Km of C02 (source: <goodplanet.org>/))
The following figures show results for a one kilometre long section of highway about 25 metres wide.
If we are talking about a road that about 1000 cars use per day (or about 1 car per minute and a half) we will need 0.27 Km2 of forest. That means a 135 metre green strip on each side of the road. This is in fact quite doable and in practice next to highways.
If we step this up to a busy city road, or a quiet highway, with about 10,000 cars per day (7 cars per minute) we will need 2.7 Km2 of forest. That means 1.35 Km on each side of the road. This becomes more difficult to implement.

So we’ve seen what would be required for 1,000 and 10,000 cars per day along a one kilometre stretch of roadway. We can now look at some traffic real data in the Luxembourg region.
The Luxembourg road works administration kindly provides accurate and current data on cars travelling through the region (<pch.public.lu]>). Luxembourg borders France, Belgium, and Germany and has a major highway linking each country to Luxembourg city. The following stats are daily averages for each border crossing along the highway – work days are higher.
France ~58,000 cars/day Belgium ~44,000 cars/day Germany ~24,000 cars/day
These imply green band requirements of 15.6, 11.9 and 6.5 square kilometres respectively. Consider that Luxembourg has 147 Km of highway. If we assume that the lowest density of travel (~24,000) along all 147 Km of highway, Luxembourg then requires 956 Km2 of green bands. The country is only 2,586 Km2 in area and already about 2/5th would be allocated for carbon compensation from the highways alone. I saw an article today in L’essentiel (Oct 5, 2010) stating that 36% (931 Km2) of the country is forested. Luxembourg’s forest are compensating for their highways alone – at most.
All these calculations have been conservative, the BMWs, Audis and Mercedes endemic to Luxembourg are definitely consuming more than 6 litres per 100 Km when travelling at 140 Km/h.